x
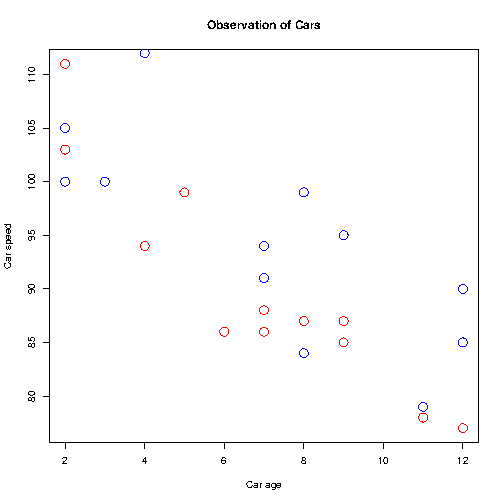
# We need this line of code to show graphs in our compilerbitmap(file="out.png")# day one, the age and speed of 12 cars:x1 <- c(5,7,8,7,2,2,9,4,11,12,9,6)y1 <- c(99,86,87,88,111,103,87,94,78,77,85,86)# day two, the age and speed of 15 cars:x2 <- c(2,2,8,1,15,8,12,9,7,3,11,4,7,14,12)y2 <- c(100,105,84,105,90,99,90,95,94,100,79,112,91,80,85)plot(x1, y1, main="Observation of Cars", xlab="Car age", ylab="Car speed", col="red", cex=2)points(x2, y2, col="blue", cex=2)